
UK Energy Market
What makes the UK energy market so attractive for innovation and disruption? The UK domestic energy market is worth around £66 billion a year and has doubled in size over the last ten years. What makes this an attractive market for innovation and what is the potential for disruption?
Referral of energy markets to CMA – an opportunity for disruptive change in the UK energy market? On 27th June 2014, Ofgem referred the UK energy market to the Competition and Markets Authority (CMA). Find out more about the investigation, market issues and related opportunity areas.
What makes the UK energy market so attractive for innovation and disruption?
The UK domestic energy market is worth around £66 billion a year. What makes this an attractive market for innovation and what is the potential for disruption?
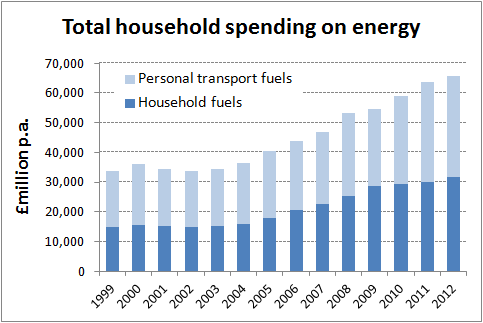
Around £32 billion a year is spent on electricity, gas and other domestic fuels, across over 26 million households. They also spend an additional £34 billion per annum on petrol and diesel for their personal transport.
The market has doubled over the last ten years (2002 to 2012).
Spending on home energy – electricity and gas – is a relatively small element of overall spending for most households. Spending on domestic electricity and gas accounts for around 8% of total spending for the lowest income households, and falls to under 5% for those with above average income. On average, it is roughly equivalent to spending on clothing and footwear, or around a third of spending on recreation and culture.
However, when combined with spending on petrol and diesel, total spending on home energy and transport fuels comes to around 10% for most households in the UK. Only the highest income decile spends a smaller share on energy.
The chart below summarises domestic energy spending in the UK by household income in 2012. The data comes from ONS Family Spending 2013 (see http://www.ons.gov.uk/ons/rel/family-spending/family-spending/2013-edition/index.html) and is by household disposable income decile for calendar year 2012.
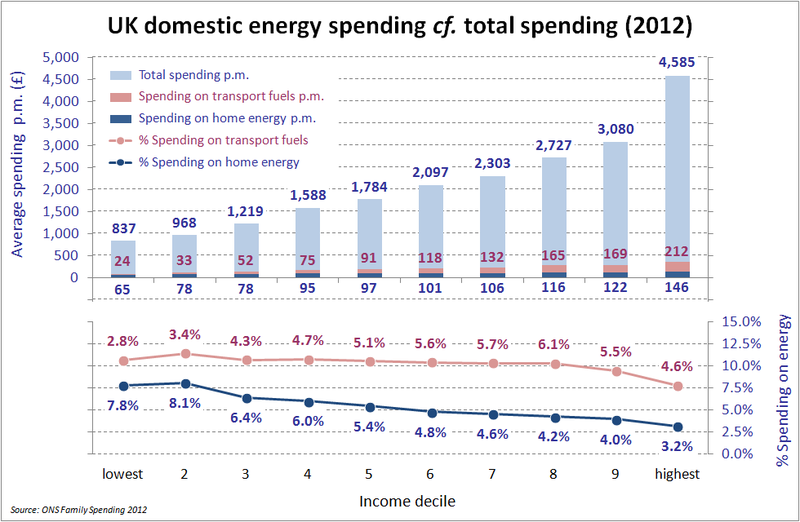
The chart is split in two – a column chart at the top showing monthly spending on home energy, transport fuels and total monthly spending; and a line chart at the bottom showing the share of total household spending on home energy and transport fuels.
The horizontal axis is split into household disposable income deciles (each decile represents about 2.6 million households), with the lowest income decile to the left and highest income decile to the right.
The monthly spending on home energy rises from £65 p.m. on average for the lowest income decile (from the column chart) to £146 p.m. on average for the highest income decile. This represents 7.8% of total household spending for the lowest income decile, falling t o3.2% for the highest income decile.
Also, monthly spending on transport fuels rises from £24 p.m. to £212 p.m. on average from lowest to highest income decile. However, this represents 2.8% of total spending for the lowest income decile rising to a peak of 6.1% for higher income deciles.
When combined spending on home energy and transport fuels represents around 10% of total spending for all households except the highest income decile.
The opportunity
The UK energy market is massive – domestic spending on home energy and personal transport fuels of around £66 billion per year.
Spending on energy of around 10% of total household spending for most households represents an attractive opportunity for ventures that can make credible and compelling propositions to reduce energy consumption and energy costs (and reduce emissions footprints).
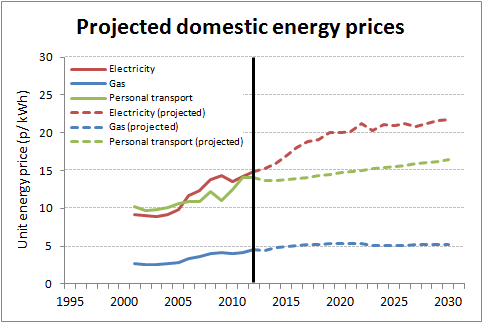
DECC’s projections for energy prices through to 2030 show, for example electricity prices expected to increase by a third by 2020 and by a half to 2030.
The market is undergoing a number of transformational changes over the next decade, including:
-
Growing prominence of renewable technologies in the generation mix, displacing fossil fuels
-
Decarbonisation of domestic heating and personal transport in support of moves towards an ever smaller emissions footprint
-
Increasing penetration of micro-generation technologies at household and community level
-
Adoption of smart technologies (such as the roll-out of smart meters) and energy efficiency measures which typically generate consumption savings of around 20% in the first 12 months
- More pervasive instrumentation of energy systems alongside developments in Internet-of-things and big data technologies (e.g. driven by Smart City initiatives)
And, in recent years the UK energy market has rarely been so attractive for new entrants:
-
Ofgem has recently referred the market for the supply and acquisition of energy in Great Britain to the Competition and Markets Authority (CMA) for investigation
-
Political attention on the UK energy market and especially the big 6 energy suppliers remains high and is likely to increase in the run up to the general election in May 2015
-
Public distrust in the big 6 energy suppliers remains high with complaints (mainly about billing) jumping in 2014
-
Ofgem continues to take a positive and supportive stance to innovation in the energy markets, particularly whilst it waits for the results of the CMA investigation
-
Transactions such as the recent acquisition of Nest Labs reinforces the high valuations possible for innovative tech solutions in the energy market
Conclusion
The UK domestic energy market is massive and is undergoing a number of transformational changes over the next decade.
Projections for unit price increases suggest continued rapid increase in electricity costs. With a move to electrification of heat and transport, householders may be hit doubly hard by the growing share of electricity in energy consumption and the increasing unit price of electricity.
If so, demand will grow from householders for reduced consumption and lower prices. This gives rise to opportunities for new consumption models (and the business models enabling them) and technologies that transform generation and distribution costs.
The Venturing Firm has tracked innovation in the energy market for over 10 years and worked with new ventures targeting new business models, new go-to-market approaches and new products and services.
If you are active in exploiting the transformational changes described above, we are keen to hear from you.